Planners use map data to visualize current and future projects. Geographic Information Systems allow us to analyze the effects of transportation projects and calculate projected changes to populations. Use our apps to learn about projects, submit your ideas and observations, or navigate through the regional network of bicycle lanes and sidewalks.

GIS users may download selected datasets for use in professional mapping applications.

Please contact Jesse Cathell at jesse.cathell@ctcog.org for any technical difficulties with the web maps.

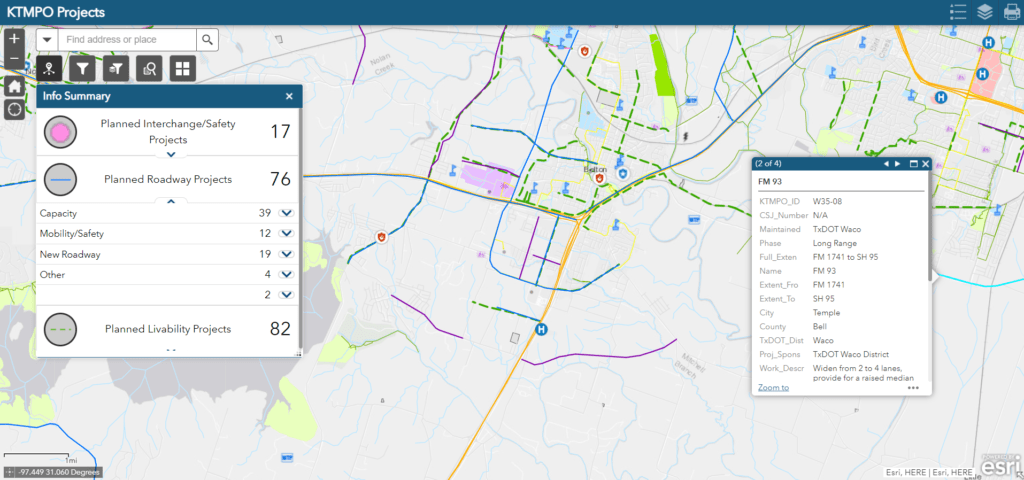
Transportation projects start life as a concept and are developed through several stages to include engineering, right-of-way, and environmental clearance. Projects are first listed in the KTMPO Metropolitan Transportation Plan (MTP) which encompasses all aspects of transportation planning within the KTMPO region. Projects are broken into Short Range Funded, Long Range Funded, and Unfunded, based upon funding anticipated to be secured over the 25-year planning horizon. Once funding is dedicated to a project, it will be listed in the Transportation Improvement Progam (TIP), which is the 4-year transportation planning document that includes a detailed listing of projects reasonably expected to begin construction within a 4 year period. Use the filters in this app to display only projects from specific plans or functional categories. Turn individual layers on and off, use the search tool to locate a project, and click on the project symbol for more information.

KTMPO Webmap
  • TxDOT Project Tracker

    Search for other projects that are in development or soon to begin construction with the TxDOT Project Tracker. You can look up the project CSJ number if you know it, or look up a county and search on the map.

  • Take me to TxDOT

Project Maps

Crash analysis

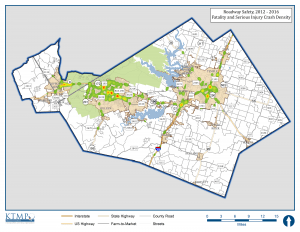
The Crash Records Information System (CRIS) is a restricted-access database that consolidates crash reports filed by law enforcement agencies. Partner agencies, such as TxDOT and metropolitan planning organizations, may use this data to analyze patterns of motor vehicle accidents in order to determine necessary changes to the road network. Specifics of individual accidents are not released due to privacy restrictions. Our staff produced this map to display visually the areas of the highest incidence of crashes that resulted in serious injury or fatalities over the last five full years.

2017 TxDOT District Map

As part of a continuing effort, TxDOT has published the 2017 District Traffic Web Map. Click here to access the map.

GIS Data downloads

Environmental Justice Communities of Concern (EJCOC) have been identified in our Public Participation Plan. The areas selected met one or more of the following criteria:

  • Census tracts with fifty percent or more of the population
    categorized as Low-to-Moderate Income by HUD.
  • Census tracts with fifty percent or more of the population identifies as minority (Black; Asian or Pacific Islander, American Indian, Eskimo or Aleut; Other Race).
  • Census tracts with twenty-five percent or more persons of Hispanic or Latino descent.

File format: ESRI shapefile (.shp) in compressed file (.zip)
File size: 136kb

Approved on June 25, 2009, the KTMPO Metropolitan Area Boundary (MAB) encompasses all of Bell County, portions of Lampasas and Coryell Counties, and portions of Fort Cavazos.

Our boundary contains 14 incorporated cities and has an area of more than 1,200 square miles. It encompasses the urbanized area and the contiguous geographical area likely to become urbanized within the 25-year forecast period covered by the Metropolitan Transportation Plan.

File format: Two ESRI shapefiles in a compressed file (.zip)
File size: 26kb

Transportation Projects are listed in the Metropolitan Transportation Plan and reflect the expected improvements over a 25-year planning horizon. These projects are scored and ranked by the Technical Advisory Committee using our Project Selection Criteria (MTP 2040 Appendix B). These criteria were developed in 2016 in order to re-evaluate our existing project list. Projects were submitted in August and the final ranked listing was approved by the Transportation Planning Policy Board on November 16, 2016.

The geodatabase contains a line feature class to represent roadways, trails, or livability projects; and a point feature class to represent bridges, rail crossings,  and interchanges. Two layer files are included to show our standard symbology.

File format: ESRI geodatabase (.gdb) in compressed file (.zip)
File size: 120KB
Updated: 6 October 2017

Approved in February 2015, the adjusted Urbanized Area (UZA) encompasses the two densely populated areas of the MPO – Killeen and Temple. Commonly referred to as the “smoothed boundary”, it includes both Census-designated Urban Areas in our region into a consolidated planning boundary.

The adjusted urban area boundary is a significant factor in developing the functional classification of roadways into urban/rural designations.

File format: ESRI shapefile in a compressed file (.zip)
File size: 86kb

Sidewalks, trails, bicycle lanes and other paths form an important part of our transportation network. our Regional Thoroughfare Plan contains detailed plans from cities throughout the region. Attend a meeting of the Bicycle/Pedestrian Advisory Committee (BPAC) to get involved! Use our BikePed map (as linked above) for the most current maps of the active transportation network, or download the shapefile (as of 30 Dec 2016) to use in your own maps.

File format: ESRI geodatabase (.gdb) in compressed file (.zip)
File size: 1874kb
Updated: 6 October 2017

Our Congestion Management Process (CMP) provides a framework for identifying congestion problems and possible solutions. The CMP employs a number of data sources, to include traffic volumes and speeds, historical patterns and public surveys, in order to identify and prioritize the most congested highway and road segments in the KTMPO region.

File format: ESRI shapefile (.shp) in compressed file (.zip)
File size: 22 kb