KTMPO has developed a series of Regional Transportation Statistics and Metrics Dashboards to provide regional policy makers, planners, stakeholders, and the public with data that details the region’s progress and status on transportation metrics such as congestion, traffic fatalities, system resiliency, and more. These dashboards allow users to examine past and present data in a way that makes it easier to evaluate the performance of transportation investments and to assess progress toward the achievement of goals for the region’s transportation network. The dashboards will also help KTMPO staff execute a performance-based approach to transportation planning and programming.
KTMPO has developed five dashboard tools to help users interact with available transportation data and to provide an interactive experience for public involvement and stakeholder engagement. These tools are:
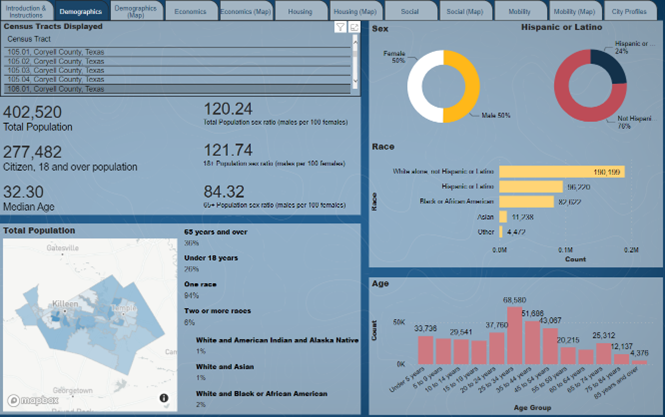
- American Community Survey (ACS) Census Data Dashboard
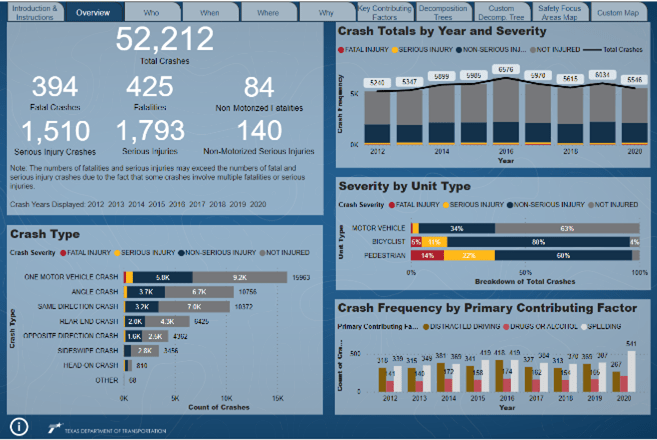
- Crash Records Information System (CRIS) Data Dashboard
- Regional Mapping Data Dashboard
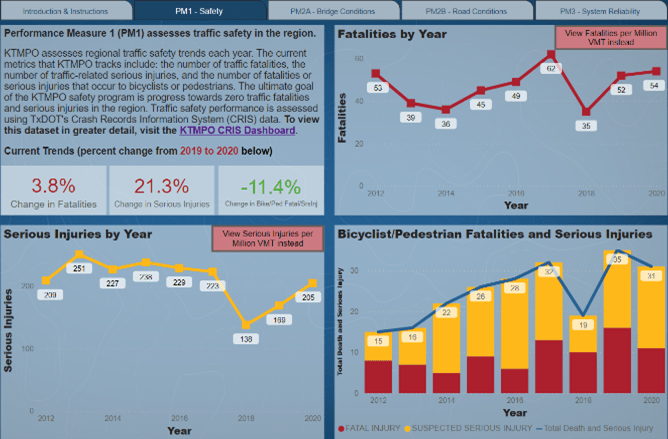
- Federal Performance Measures Dashboard
- Transportation Improvement Program (TIP) Project Viewer Dashboard
Please contact James McGill at james.mcgill@ctcog.org with questions related to the Regional Transportation Statistics and Metrics Dashboards.


